LR001391
| General data | |
|---|---|
| UTM coordinates | DG61 |
| Municipality | Tordera |
| Typology | Mine |
| Use | Non-specified |
| Inspections | 2 |
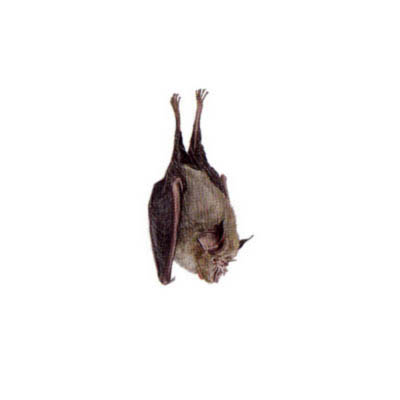
| Species | 3 |
| Conservartion priority (BRP) |
|
| Biological importance (BI) |
|
Evolution of counts of
Each bar represents the total number of bats in the roost. Through the menu, it is possible to visualize the total bat counts (including all bat species) or the total count for each species. The bar colour corresponds to each season.
Phenology of
Each point represents the number of individuals for each species counted during the monthly census along the whole year. With this information you can confirm the phenology of the roost for each species, as well as the diffferent activity peaks along their annual cycle. You can use the menu the viualize each species counts or the total count.